area-chart-2
Single block view - Copy and use this block in your project: area-chart-2
Loading...
charts/area-charts/area-chart-2.tsx
"use client";
import React, { useState } from "react";
import {
Card,
CardContent,
CardHeader,
CardTitle,
CardToolbar,
} from "@/registry/default/ui/card/radix";
import {
ChartConfig,
ChartContainer,
ChartTooltip,
} from "@/registry/default/ui/chart";
import {
Select,
SelectContent,
SelectItem,
SelectTrigger,
SelectValue,
} from "@/registry/default/ui/select/radix";
import {
CreditCard,
Eye,
ShoppingCart,
Store,
TrendingDown,
TrendingUp,
} from "lucide-react";
import { Area, AreaChart, CartesianGrid, XAxis, YAxis } from "recharts";
import { cn } from "@/lib/utils";
// E-commerce conversion funnel data for different periods
const conversionFunnelData = {
"7d": [
{
period: "Mon",
storeVisits: 2500,
productViews: 2100,
addToCart: 1400,
checkout: 1200,
},
{
period: "Tue",
storeVisits: 2800,
productViews: 2300,
addToCart: 1600,
checkout: 1350,
},
{
period: "Wed",
storeVisits: 1900,
productViews: 1500,
addToCart: 950,
checkout: 780,
},
{
period: "Thu",
storeVisits: 3100,
productViews: 2600,
addToCart: 1800,
checkout: 1500,
},
{
period: "Fri",
storeVisits: 2400,
productViews: 1900,
addToCart: 1200,
checkout: 980,
},
{
period: "Sat",
storeVisits: 3400,
productViews: 2800,
addToCart: 1950,
checkout: 1620,
},
{
period: "Sun",
storeVisits: 2100,
productViews: 1700,
addToCart: 1100,
checkout: 850,
},
],
"30d": [
{
period: "Week 1",
storeVisits: 18500,
productViews: 15200,
addToCart: 10800,
checkout: 8900,
},
{
period: "Week 2",
storeVisits: 21200,
productViews: 17800,
addToCart: 12400,
checkout: 10200,
},
{
period: "Week 3",
storeVisits: 16800,
productViews: 13500,
addToCart: 8900,
checkout: 7200,
},
{
period: "Week 4",
storeVisits: 14200,
productViews: 11200,
addToCart: 7800,
checkout: 6100,
},
{
period: "Week 5",
storeVisits: 19800,
productViews: 16500,
addToCart: 11200,
checkout: 9400,
},
{
period: "Week 6",
storeVisits: 22800,
productViews: 19100,
addToCart: 13500,
checkout: 11200,
},
],
"90d": [
{
period: "Jan",
storeVisits: 78000,
productViews: 65000,
addToCart: 45000,
checkout: 37000,
},
{
period: "Feb",
storeVisits: 82000,
productViews: 68500,
addToCart: 48000,
checkout: 39500,
},
{
period: "Mar",
storeVisits: 69000,
productViews: 54000,
addToCart: 36000,
checkout: 28500,
},
{
period: "Apr",
storeVisits: 61000,
productViews: 47000,
addToCart: 31000,
checkout: 24000,
},
{
period: "May",
storeVisits: 75000,
productViews: 62000,
addToCart: 43000,
checkout: 35500,
},
{
period: "Jun",
storeVisits: 84000,
productViews: 71000,
addToCart: 49000,
checkout: 41000,
},
],
"12m": [
{
period: "Q1",
storeVisits: 235000,
productViews: 195000,
addToCart: 136000,
checkout: 112000,
},
{
period: "Q2",
storeVisits: 268000,
productViews: 223000,
addToCart: 156000,
checkout: 128000,
},
{
period: "Q3",
storeVisits: 198000,
productViews: 158000,
addToCart: 105000,
checkout: 82000,
},
{
period: "Q4",
storeVisits: 175000,
productViews: 138000,
addToCart: 89000,
checkout: 68000,
},
{
period: "Q1 24",
storeVisits: 251000,
productViews: 209000,
addToCart: 146000,
checkout: 120000,
},
{
period: "Q2 24",
storeVisits: 289000,
productViews: 241000,
addToCart: 168000,
checkout: 138000,
},
],
};
const chartConfig = {
storeVisits: {
label: "Store Visits",
color: "var(--color-indigo-400)",
},
productViews: {
label: "Product Views",
color: "var(--color-indigo-500)",
},
addToCart: {
label: "Add to Cart",
color: "var(--color-indigo-600)",
},
checkout: {
label: "Checkout",
color: "var(--color-indigo-700)",
},
} satisfies ChartConfig;
// Period configuration
const PERIODS = {
"7d": { key: "7d", label: "Last 7 days" },
"30d": { key: "30d", label: "Last 30 days" },
"90d": { key: "90d", label: "Last 90 days" },
"12m": { key: "12m", label: "Last 12 months" },
} as const;
type PeriodKey = keyof typeof PERIODS;
// Define stage metrics
const stageMetrics = [
{
key: "storeVisits",
label: "Store Visits",
icon: Store,
color: chartConfig.storeVisits.color,
},
{
key: "productViews",
label: "Product Views",
icon: Eye,
color: chartConfig.productViews.color,
},
{
key: "addToCart",
label: "Add to Cart",
icon: ShoppingCart,
color: chartConfig.addToCart.color,
},
{
key: "checkout",
label: "Checkout",
icon: CreditCard,
color: chartConfig.checkout.color,
},
] as const;
// Custom Tooltip Component
interface TooltipProps {
active?: boolean;
payload?: Array<{
dataKey: string;
value: number;
color: string;
}>;
label?: string;
}
const CustomTooltip = ({ active, payload, label }: TooltipProps) => {
if (active && payload && payload.length) {
return (
<div className="rounded-lg border bg-popover/95 backdrop-blur-sm p-4 shadow-lg min-w-[200px]">
<div className="text-sm font-semibold text-popover-foreground mb-3.5 pb-2 border-b border-border/50">
{label}
</div>
<div className="space-y-1.5">
{stageMetrics.map((stage) => {
const dataPoint = payload.find((p) => p.dataKey === stage.key);
const value = dataPoint?.value || 0;
return (
<div
key={stage.key}
className="flex items-center justify-between gap-1.5"
>
<div className="flex items-center gap-2">
<div
className="size-2.5 rounded-sm"
style={{ backgroundColor: stage.color }}
/>
<span className="text-xs font-medium text-muted-foreground">
{stage.label}
</span>
</div>
<span className="text-sm font-semibold text-popover-foreground">
{value.toLocaleString()}
</span>
</div>
);
})}
</div>
</div>
);
}
return null;
};
export default function AreaChart2() {
const [selectedPeriod, setSelectedPeriod] = useState<PeriodKey>("30d");
// Get data for selected period
const currentData = conversionFunnelData[selectedPeriod];
// Calculate current totals for the latest data point
const latestData = currentData[currentData.length - 1];
// Calculate percentage changes (simulated based on period)
const getChangeForMetric = (metric: string) => {
const changes = {
"7d": { storeVisits: -16, productViews: 8, addToCart: -12, checkout: 5 },
"30d": { storeVisits: 23, productViews: -7, addToCart: 15, checkout: -4 },
"90d": { storeVisits: 12, productViews: 18, addToCart: -8, checkout: 21 },
"12m": {
storeVisits: -5,
productViews: 23,
addToCart: 32,
checkout: -11,
},
};
return (
changes[selectedPeriod][
metric as keyof (typeof changes)[typeof selectedPeriod]
] || 0
);
};
return (
<div className="min-h-screen flex items-center justify-center p-6 lg:p-8">
<Card className="w-full max-w-5xl">
<CardHeader className="border-0 min-h-auto py-6">
<CardTitle className="text-lg font-semibold">
Conversion Funnel
</CardTitle>
<CardToolbar>
{/* Period Selector */}
<Select
value={selectedPeriod}
onValueChange={(value) => setSelectedPeriod(value as PeriodKey)}
>
<SelectTrigger>
<SelectValue />
</SelectTrigger>
<SelectContent align="end">
{Object.values(PERIODS).map((period) => (
<SelectItem key={period.key} value={period.key}>
{period.label}
</SelectItem>
))}
</SelectContent>
</Select>
</CardToolbar>
</CardHeader>
<CardContent className="px-2.5">
{/* Stats Section */}
<div className="@container px-2.5">
<div className="grid @3xl:grid-cols-2 @4xl:grid-cols-4 gap-6 mb-10">
{stageMetrics.map((stage) => {
const value = latestData[
stage.key as keyof typeof latestData
] as number;
const change = getChangeForMetric(stage.key);
return (
<div key={stage.key} className="space-y-1">
<div className="flex items-center gap-2.5">
<div className="w-0.5 h-12 rounded-full bg-border"></div>
<div className="flex flex-col gap-2">
<div className="text-sm font-medium text-muted-foreground">
{stage.label}
</div>
<div className="flex items-center gap-2.5">
<span className="text-2xl font-semibold leading-none">
{value.toLocaleString()}
</span>
<span
className={cn(
"inline-flex items-center gap-1 text-xs font-medium",
change >= 0
? "text-green-500"
: "text-destructive",
)}
>
{change >= 0 ? (
<TrendingUp className="size-4" />
) : (
<TrendingDown className="size-4" />
)}{" "}
{/* TODO: Add icon */}
{Math.abs(change)}%
</span>
</div>
</div>
</div>
</div>
);
})}
</div>
</div>
{/* Chart */}
<ChartContainer
config={chartConfig}
className="h-[400px] w-full [&_.recharts-curve.recharts-tooltip-cursor]:stroke-initial"
>
<AreaChart
accessibilityLayer
data={currentData}
margin={{
top: 10,
bottom: 10,
left: 20,
right: 20,
}}
>
{/* Background pattern for chart area only */}
<defs>
{/* Modern Abstract Background Pattern */}
<pattern
id="modernPattern"
x="0"
y="0"
width="32"
height="32"
patternUnits="userSpaceOnUse"
>
{/* Diagonal grid lines */}
<path
d="M0,16 L32,16 M16,0 L16,32"
stroke="var(--muted-foreground)"
strokeWidth="0.5"
strokeOpacity="0.03"
/>
<path
d="M0,0 L32,32 M0,32 L32,0"
stroke="var(--muted-foreground)"
strokeWidth="0.3"
strokeOpacity="0.02"
/>
{/* Modern geometric elements */}
<circle
cx="8"
cy="8"
r="1.5"
fill="var(--muted-foreground)"
fillOpacity="0.04"
/>
<circle
cx="24"
cy="24"
r="1.5"
fill="var(--muted-foreground)"
fillOpacity="0.04"
/>
{/* Abstract rounded rectangles */}
<rect
x="12"
y="4"
width="8"
height="2"
rx="1"
fill="var(--muted-foreground)"
fillOpacity="0.02"
/>
<rect
x="4"
y="26"
width="8"
height="2"
rx="1"
fill="var(--muted-foreground)"
fillOpacity="0.02"
/>
<rect
x="20"
y="12"
width="2"
height="8"
rx="1"
fill="var(--muted-foreground)"
fillOpacity="0.02"
/>
{/* Minimal dots */}
<circle
cx="6"
cy="20"
r="0.5"
fill="var(--muted-foreground)"
fillOpacity="0.06"
/>
<circle
cx="26"
cy="10"
r="0.5"
fill="var(--muted-foreground)"
fillOpacity="0.06"
/>
<circle
cx="14"
cy="28"
r="0.5"
fill="var(--muted-foreground)"
fillOpacity="0.06"
/>
</pattern>
<linearGradient
id="fillStoreVisits"
x1="0"
y1="0"
x2="0"
y2="1"
>
<stop
offset="5%"
stopColor="var(--color-storeVisits)"
stopOpacity={0.8}
/>
<stop
offset="95%"
stopColor="var(--color-storeVisits)"
stopOpacity={0.1}
/>
</linearGradient>
<linearGradient
id="fillProductViews"
x1="0"
y1="0"
x2="0"
y2="1"
>
<stop
offset="5%"
stopColor="var(--color-productViews)"
stopOpacity={0.8}
/>
<stop
offset="95%"
stopColor="var(--color-productViews)"
stopOpacity={0.1}
/>
</linearGradient>
<linearGradient id="fillAddToCart" x1="0" y1="0" x2="0" y2="1">
<stop
offset="5%"
stopColor="var(--color-addToCart)"
stopOpacity={0.8}
/>
<stop
offset="95%"
stopColor="var(--color-addToCart)"
stopOpacity={0.1}
/>
</linearGradient>
<linearGradient id="fillCheckout" x1="0" y1="0" x2="0" y2="1">
<stop
offset="5%"
stopColor="var(--color-checkout)"
stopOpacity={0.8}
/>
<stop
offset="95%"
stopColor="var(--color-checkout)"
stopOpacity={0.1}
/>
</linearGradient>
</defs>
<CartesianGrid vertical={false} />
<XAxis
dataKey="period"
tickLine={false}
axisLine={false}
tickMargin={10}
tick={{ textAnchor: "middle", fontSize: 12 }}
interval={0}
/>
<YAxis hide />
<ChartTooltip
cursor={{
strokeDasharray: "4 4",
stroke: "oklch(45.7% 0.24 277.023)",
strokeWidth: 1,
strokeOpacity: 0.6,
}}
content={<CustomTooltip />}
offset={20}
position={{ x: undefined, y: undefined }}
/>
{/* Background Pattern Areas */}
<Area
dataKey="storeVisits"
type="natural"
fill="url(#modernPattern)"
fillOpacity={1}
stroke="transparent"
stackId="pattern"
dot={false}
activeDot={false}
/>
<Area
dataKey="productViews"
type="natural"
fill="url(#modernPattern)"
fillOpacity={1}
stroke="transparent"
stackId="pattern"
dot={false}
activeDot={false}
/>
<Area
dataKey="addToCart"
type="natural"
fill="url(#modernPattern)"
fillOpacity={1}
stroke="transparent"
stackId="pattern"
dot={false}
activeDot={false}
/>
<Area
dataKey="checkout"
type="natural"
fill="url(#modernPattern)"
fillOpacity={1}
stroke="transparent"
stackId="pattern"
dot={false}
activeDot={false}
/>
{/* Stacked Areas */}
<Area
dataKey="checkout"
type="natural"
fill="url(#fillCheckout)"
fillOpacity={0.5}
stroke="var(--color-checkout)"
stackId="a"
dot={false}
activeDot={{
r: 4,
fill: "var(--color-checkout)",
stroke: "white",
strokeWidth: 1.5,
}}
/>
<Area
dataKey="addToCart"
type="natural"
fill="url(#fillAddToCart)"
fillOpacity={0.4}
stroke="var(--color-addToCart)"
stackId="a"
dot={false}
activeDot={{
r: 4,
fill: "var(--color-addToCart)",
stroke: "white",
strokeWidth: 1.5,
}}
/>
<Area
dataKey="productViews"
type="natural"
fill="url(#fillProductViews)"
fillOpacity={0.3}
stroke="var(--color-productViews)"
stackId="a"
dot={false}
activeDot={{
r: 4,
fill: "var(--color-productViews)",
stroke: "white",
strokeWidth: 1.5,
}}
/>
<Area
dataKey="storeVisits"
type="natural"
fill="url(#fillStoreVisits)"
fillOpacity={0.2}
stroke="var(--color-storeVisits)"
stackId="a"
dot={false}
activeDot={{
r: 4,
fill: "var(--color-storeVisits)",
stroke: "white",
strokeWidth: 1.5,
}}
/>
</AreaChart>
</ChartContainer>
</CardContent>
</Card>
</div>
);
}
Component Data
- Name:
- Area Chart 2 – E-commerce Conversion Funnel
- Access:
- Pro
- Created:
- 2025-12-01
- Updated:
- 2026-02-01
- Released:
- N/A
- Type:
- Block
area-chartchartdashboardanalyticsecommerceconversionfunnelstackedrechartstailwindreact
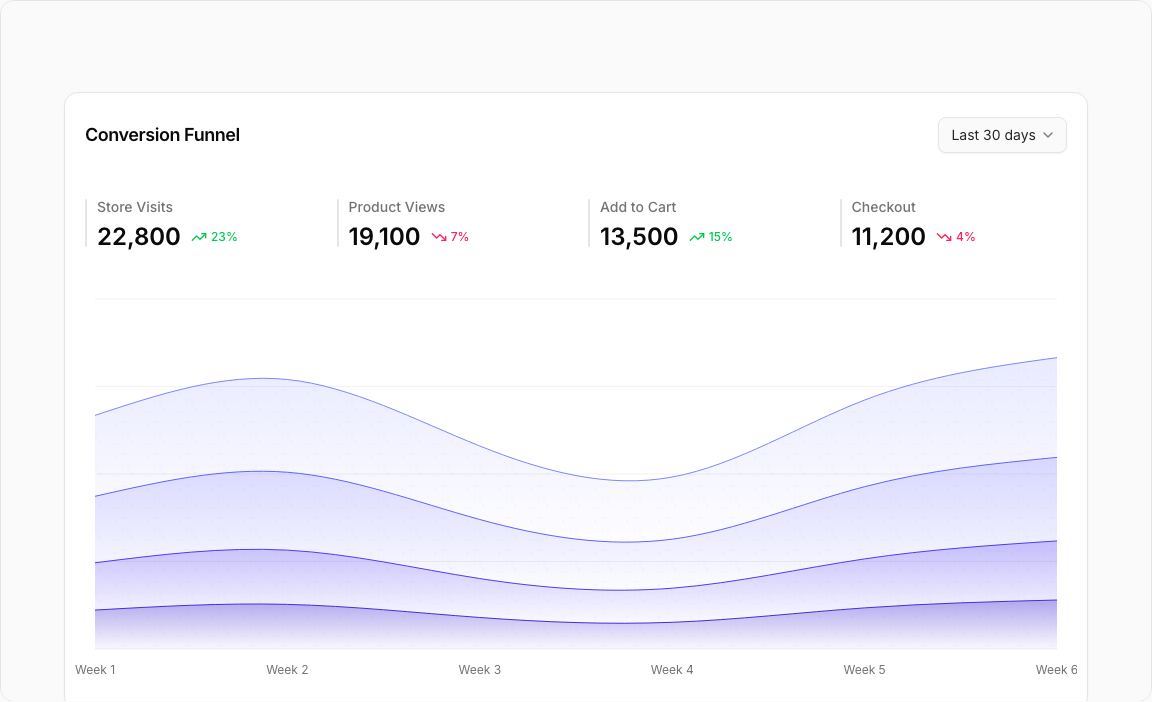
Area Chart 2 – Conversion Funnel Analytics
A sophisticated stacked area chart displaying the complete e-commerce conversion funnel. Track customer journey from store visits through product views, add to cart, and checkout stages.
Key Features
- Four Funnel Stages – Store Visits, Product Views, Add to Cart, Checkout.
- Stacked Visualization – Clear view of funnel progression.
- Period Selector – 7D, 30D, 90D, 12M data ranges.
- Stage Metrics – Individual statistics for each funnel stage.
- Trend Indicators – Up/down percentages for each metric.
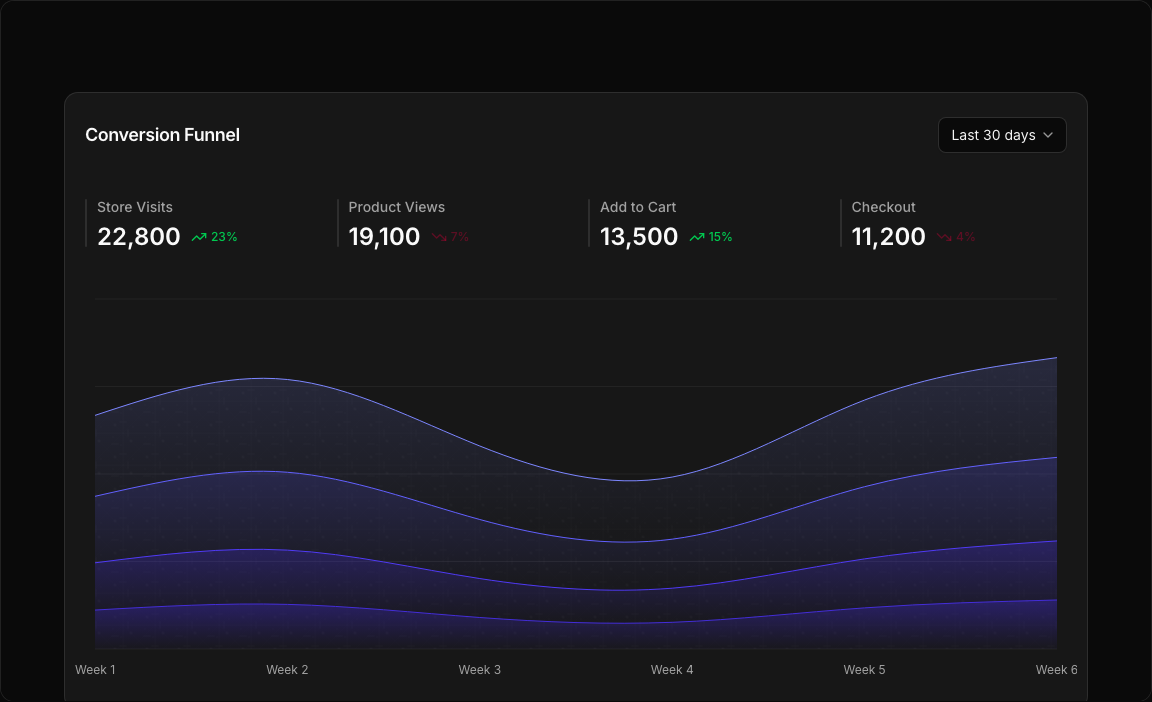
Visual Design
- Color Scheme – Distinct colors for each funnel stage.
- Stacked Areas – Visual representation of conversion rates.
- Metric Cards – Icon-based stage indicators with stats.
Use Cases
- E-commerce Analytics – Monitor conversion pipeline.
- Marketing Funnels – Track customer journey.
- Sales Analysis – Identify drop-off points.
- A/B Testing – Compare funnel performance.
Technical Stack
- Recharts – AreaChart with stacked areas.
- Tailwind CSS – Multi-color funnel visualization.
- Radix UI – Select, Card components.
- Lucide Icons – Store, Eye, ShoppingCart, CreditCard.
Didn't find what you were looking for?
Suggest block