line-chart-9
Single block view - Copy and use this block in your project: line-chart-9
Loading...
charts/line-charts/line-chart-9.tsx
"use client";
import React from "react";
import { Card, CardContent } from "@/registry/default/ui/card/radix";
import {
ChartConfig,
ChartContainer,
ChartTooltip,
} from "@/registry/default/ui/chart";
import { TrendingUp } from "lucide-react";
import {
CartesianGrid,
ComposedChart,
Line,
ReferenceLine,
XAxis,
YAxis,
} from "recharts";
// E-commerce revenue tracking with seasonal fluctuations
const portfolioData = [
{ date: "Jan 1", value: 850, time: "20:00" },
{ date: "Jan 2", value: 1100, time: "00:00" },
{ date: "Jan 3", value: 1680, time: "04:00" },
{ date: "Jan 4", value: 1490, time: "08:00" },
{ date: "Jan 5", value: 2020, time: "12:00" },
{ date: "Jan 6", value: 2080, time: "16:00" },
{ date: "Jan 7", value: 2180, time: "20:00" },
{ date: "Jan 8", value: 2250, time: "00:00" },
{ date: "Jan 9", value: 2480, time: "04:00" },
{ date: "Jan 10", value: 2290, time: "08:00" },
{ date: "Jan 11", value: 2450, time: "12:00" },
{ date: "Jan 12", value: 2380, time: "16:00" },
{ date: "Jan 13", value: 2220, time: "20:00" },
{ date: "Jan 14", value: 1980, time: "00:00" },
{ date: "Jan 15", value: 1750, time: "04:00" },
{ date: "Jan 16", value: 1620, time: "08:00" },
{ date: "Jan 17", value: 1480, time: "12:00" },
{ date: "Jan 18", value: 1580, time: "16:00" },
{ date: "Jan 19", value: 1820, time: "20:00" },
{ date: "Jan 20", value: 1950, time: "00:00" },
{ date: "Jan 21", value: 2080, time: "04:00" },
{ date: "Jan 22", value: 2220, time: "08:00" },
{ date: "Jan 23", value: 2380, time: "12:00" },
{ date: "Jan 24", value: 2550, time: "16:00" },
{ date: "Jan 25", value: 2480, time: "20:00" },
{ date: "Jan 26", value: 2720, time: "00:00" },
{ date: "Jan 27", value: 2900, time: "04:00" },
{ date: "Jan 28", value: 2550, time: "08:00" },
{ date: "Jan 29", value: 2320, time: "12:00" },
{ date: "Feb 15", value: 2250, time: "14:00" },
{ date: "Mar 24", value: 1900, time: "16:00" },
];
// Chart configuration
const chartConfig = {
value: {
label: "Balance",
color: "var(--color-purple-500)",
},
} satisfies ChartConfig;
// Calculate portfolio metrics
const currentBalance = 24847.83;
const todaysPnL = 1249.0;
const pnlPercentage = 8;
const highValue = Math.max(...portfolioData.map((d) => d.value));
const lowValue = Math.min(...portfolioData.map((d) => d.value));
const change = -0.082;
// Custom Tooltip
interface TooltipProps {
active?: boolean;
payload?: Array<{
payload: {
date: string;
value: number;
};
}>;
label?: string;
}
const CustomTooltip = ({ active, payload }: TooltipProps) => {
if (active && payload && payload.length) {
const data = payload[0].payload;
return (
<div className="bg-popover border border-border rounded-lg p-3 shadow-lg">
<div className="text-sm text-muted-foreground mb-1">{data.date}</div>
<div className="flex items-center gap-2">
<div className="text-base font-bold">
${(data.value * 10).toLocaleString()}.00
</div>
<div className="text-[11px] text-emerald-600">+12.7%</div>
</div>
</div>
);
}
return null;
};
export default function LineChart9() {
return (
<div className="min-h-screen flex items-center justify-center p-6">
<Card className="w-full max-w-5xl">
<CardContent className="flex flex-col items-stretch gap-5">
{/* Header */}
<div className="mb-5">
<h1 className="text-base text-muted-foreground font-medium mb-1">
Current Balance
</h1>
<div className="flex flex-wrap items-baseline gap-1.5 sm:gap-3.5">
<span className="text-4xl font-bold">
${currentBalance.toLocaleString()}
</span>
<div className="flex items-center gap-1 text-emerald-600">
<TrendingUp className="w-4 h-4" />
<span className="font-medium">+12.7%</span>
<span className="text-muted-foreground font-normal">
Last 24 hours
</span>
</div>
</div>
</div>
<div className="grow">
{/* Stats Row */}
<div className="flex items-center justify-between flex-wrap gap-2.5 text-sm mb-2.5">
{/* Today's Sales */}
<div className="flex items-center gap-6">
<div className="flex items-center gap-2">
<span className="text-muted-foreground">
Today's Sales:
</span>
<span className="font-semibold">
${todaysPnL.toLocaleString()}
</span>
<div className="flex items-center gap-1 text-emerald-600">
<TrendingUp className="w-3 h-3" />
<span>(+{pnlPercentage}%)</span>
</div>
</div>
</div>
{/* Stats Row */}
<div className="flex items-center gap-6 text-muted-foreground">
<span>
High:{" "}
<span className="text-sky-600 font-medium">
{highValue.toLocaleString()}.08
</span>
</span>
<span>
Low:{" "}
<span className="text-yellow-600 font-medium">
{lowValue.toLocaleString()}.42
</span>
</span>
<span>
Change:{" "}
<span className="text-red-600 font-medium">{change}%</span>
</span>
</div>
</div>
{/* Chart */}
<ChartContainer
config={chartConfig}
className="h-96 w-full [&_.recharts-curve.recharts-tooltip-cursor]:stroke-initial"
>
<ComposedChart
data={portfolioData}
margin={{
top: 20,
right: 10,
left: 5,
bottom: 20,
}}
>
<defs>
<linearGradient id="areaGradient" x1="0" y1="0" x2="0" y2="1">
<stop
offset="0%"
stopColor={chartConfig.value.color}
stopOpacity={0.1}
/>
<stop
offset="100%"
stopColor={chartConfig.value.color}
stopOpacity={0}
/>
</linearGradient>
<pattern
id="dotGrid"
x="0"
y="0"
width="20"
height="20"
patternUnits="userSpaceOnUse"
>
<circle
cx="10"
cy="10"
r="1"
fill="var(--input)"
fillOpacity="0.3"
/>
</pattern>
<filter
id="dotShadow"
x="-50%"
y="-50%"
width="200%"
height="200%"
>
<feDropShadow
dx="2"
dy="3"
stdDeviation="3"
floodColor="rgba(0,0,0,0.8)"
/>
</filter>
<filter
id="lineShadow"
x="-100%"
y="-100%"
width="300%"
height="300%"
>
<feDropShadow
dx="4"
dy="6"
stdDeviation="25"
floodColor="rgba(59, 130, 246, 0.9)"
/>
</filter>
</defs>
<rect
x="0"
y="0"
width="100%"
height="100%"
fill="url(#dotGrid)"
style={{ pointerEvents: "none" }}
/>
<CartesianGrid
strokeDasharray="4 8"
stroke="var(--input)"
strokeOpacity={1}
horizontal={true}
vertical={false}
/>
{/* Active tick reference line */}
<ReferenceLine
x="Jan 17"
stroke={chartConfig.value.color}
strokeDasharray="4 4"
strokeWidth={1}
/>
<XAxis
dataKey="date"
axisLine={false}
tickLine={false}
tick={{ fontSize: 12, fill: chartConfig.value.color }}
tickMargin={15}
interval="preserveStartEnd"
tickCount={5}
/>
<YAxis
axisLine={false}
tickLine={false}
tick={{ fontSize: 12, fill: chartConfig.value.color }}
tickFormatter={(value) => `$${(value * 2).toLocaleString()}`}
tickMargin={15}
/>
<ChartTooltip
content={<CustomTooltip />}
cursor={{
strokeDasharray: "3 3",
stroke: "var(--muted-foreground)",
strokeOpacity: 0.5,
}}
/>
<Line
type="monotone"
dataKey="value"
stroke={chartConfig.value.color}
strokeWidth={2}
filter="url(#lineShadow)"
dot={(props) => {
const { cx, cy, payload } = props;
if (
payload.date === "Jan 17" ||
payload.value > 2800 ||
payload.value < 1000
) {
return (
<circle
key={`dot-${payload.date}`}
cx={cx}
cy={cy}
r={6}
fill={chartConfig.value.color}
stroke="white"
strokeWidth={2}
filter="url(#dotShadow)"
/>
);
}
return <g key={`dot-${payload.date}`} />; // Return empty group for other points
}}
activeDot={{
r: 6,
fill: chartConfig.value.color,
stroke: "white",
strokeWidth: 2,
filter: "url(#dotShadow)",
}}
/>
</ComposedChart>
</ChartContainer>
</div>
</CardContent>
</Card>
</div>
);
}
Component Data
- Name:
- Line Chart 9 – Portfolio Balance Dashboard
- Access:
- Pro
- Created:
- 2025-12-01
- Updated:
- 2026-02-01
- Released:
- N/A
- Type:
- Block
line-chartchartdashboardanalyticsportfoliofinancebalanceinvestmentrechartstailwindreact
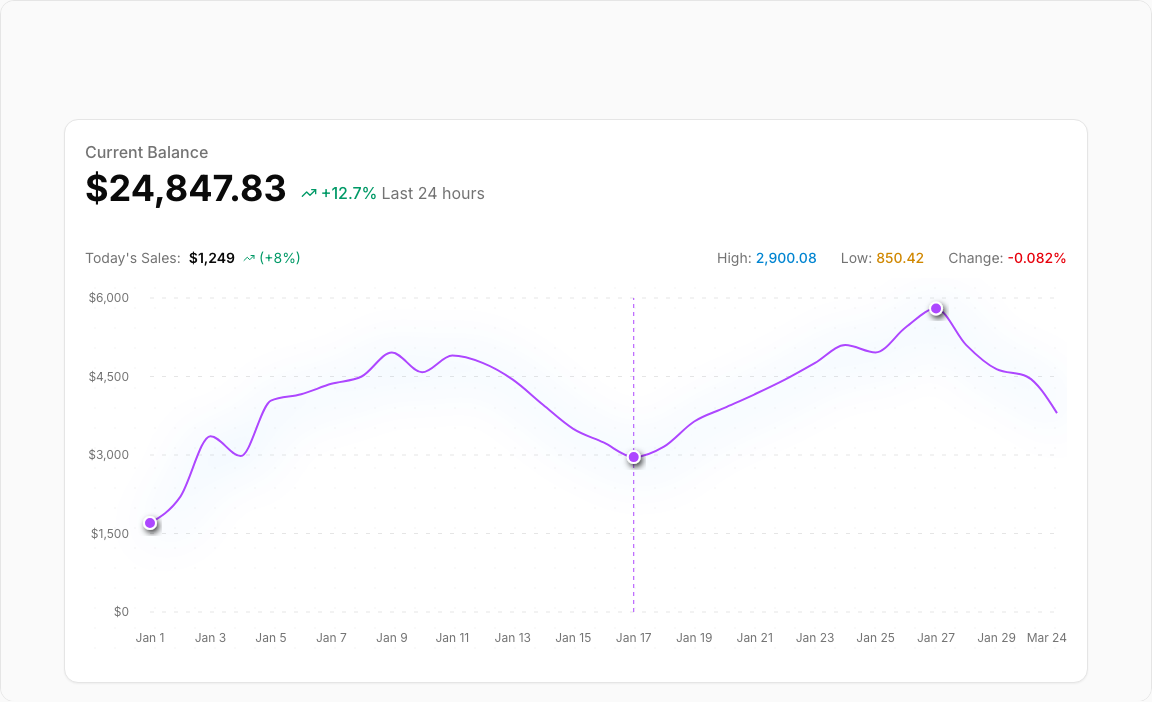
Line Chart 9 – Portfolio Balance Tracker
A professional portfolio balance visualization with comprehensive statistics. Features current balance display, daily performance metrics, and historical trend line with reference lines.
Key Features
- Balance Display – Large current balance with trend percentage.
- Daily P&L – Today's profit/loss with percentage indicator.
- High/Low Values – Track performance range for the period.
- Reference Lines – Visual markers for high and low points.
- Date Axis – Time-series display with readable labels.
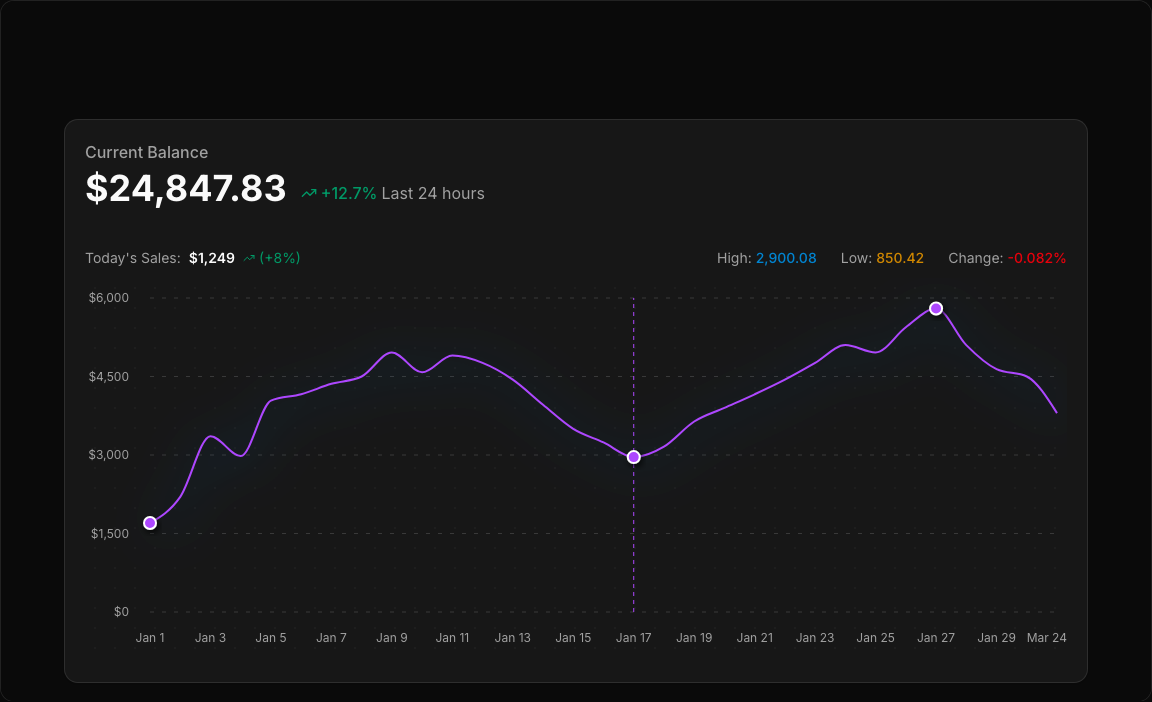
Visual Design
- Color Scheme – Purple-500 primary with emerald trend indicators.
- Reference Lines – Dashed lines at high/low values.
- Clean Header – Balance prominently displayed with supporting stats.
Use Cases
- Investment Dashboards – Track portfolio performance.
- Trading Platforms – Display account balance trends.
- Crypto Wallets – Monitor digital asset values.
- Financial Apps – Personal finance tracking.
Technical Stack
- Recharts – ComposedChart with Line and ReferenceLine.
- Tailwind CSS – Purple/emerald color palette.
- Radix UI – Card, ChartContainer components.
- Lucide Icons – TrendingUp for positive trends.
Didn't find what you were looking for?
Suggest block