line-chart-8
Single block view - Copy and use this block in your project: line-chart-8
Loading...
charts/line-charts/line-chart-8.tsx
"use client";

import React from "react";
import { Card, CardContent } from "@/registry/default/ui/card/radix";
import {
  Line,
  LineChart,
  ReferenceLine,
  ResponsiveContainer,
  Tooltip,
  YAxis,
} from "recharts";

// Business Case 1: SaaS Revenue Tracking (Detailed wavy pattern with micro-fluctuations)
const revenueData = [
  { value: 15000 },
  { value: 18000 },
  { value: 25000 },
  { value: 32000 },
  { value: 35000 },
  { value: 28000 },
  { value: 20000 },
  { value: 12000 },
  { value: 5000 },
  { value: -2000 },
  { value: -10000 },
  { value: -18000 },
  { value: -25000 },
  { value: -22000 },
  { value: -15000 },
  { value: -8000 },
  { value: 0 },
  { value: 8000 },
  { value: 20000 },
  { value: 28000 },
  { value: 40000 },
  { value: 48000 },
  { value: 50000 },
  { value: 45000 },
  { value: 35000 },
  { value: 25000 },
  { value: 15000 },
  { value: 2000 },
  { value: -5000 },
  { value: -12000 },
  { value: -20000 },
  { value: -28000 },
  { value: -30000 },
  { value: -25000 },
  { value: -15000 },
  { value: -5000 },
  { value: 10000 },
  { value: 22000 },
  { value: 35000 },
  { value: 45000 },
  { value: 55000 },
  { value: 52000 },
  { value: 45000 },
  { value: 35000 },
  { value: 25000 },
  { value: 12000 },
  { value: 5000 },
  { value: -8000 },
  { value: -15000 },
  { value: -12000 },
  { value: -5000 },
  { value: 3000 },
  { value: 15000 },
  { value: 25000 },
  { value: 20000 },
  { value: 10000 },
  { value: -2000 },
  { value: -15000 },
  { value: -20000 },
  { value: -15000 },
];

// Business Case 2: E-commerce Conversion Rate (Detailed sine wave with micro-variations)
const conversionData = [
  { value: 0 },
  { value: 0.8 },
  { value: 1.5 },
  { value: 2.2 },
  { value: 2.8 },
  { value: 3.2 },
  { value: 3.5 },
  { value: 3.4 },
  { value: 3.2 },
  { value: 2.6 },
  { value: 2.0 },
  { value: 1.2 },
  { value: 0.5 },
  { value: -0.2 },
  { value: -1.2 },
  { value: -1.8 },
  { value: -2.5 },
  { value: -2.8 },
  { value: -3.0 },
  { value: -2.9 },
  { value: -2.8 },
  { value: -2.2 },
  { value: -1.5 },
  { value: -0.8 },
  { value: 0.2 },
  { value: 1.0 },
  { value: 2.0 },
  { value: 2.8 },
  { value: 3.5 },
  { value: 3.9 },
  { value: 4.2 },
  { value: 4.1 },
  { value: 3.8 },
  { value: 3.2 },
  { value: 2.5 },
  { value: 1.5 },
  { value: 0.8 },
  { value: 0.2 },
  { value: -1.0 },
  { value: -1.6 },
  { value: -2.5 },
  { value: -2.9 },
  { value: -3.2 },
  { value: -3.0 },
  { value: -2.0 },
  { value: -1.2 },
  { value: 0 },
  { value: 1.2 },
  { value: 2.5 },
  { value: 3.5 },
  { value: 4.0 },
  { value: 3.8 },
  { value: 2.8 },
  { value: 1.5 },
  { value: 0.5 },
  { value: -0.8 },
  { value: -2.0 },
  { value: -2.8 },
  { value: -2.5 },
  { value: -1.0 },
];

// Business Case 3: Server Performance Monitoring (Detailed oscillating decline with volatility)
const performanceData = [
  { value: 5 },
  { value: 8 },
  { value: 10 },
  { value: 12 },
  { value: 8 },
  { value: 5 },
  { value: 3 },
  { value: 0 },
  { value: -2 },
  { value: -5 },
  { value: -8 },
  { value: -10 },
  { value: -12 },
  { value: -10 },
  { value: -8 },
  { value: -5 },
  { value: -3 },
  { value: 0 },
  { value: 2 },
  { value: 4 },
  { value: 6 },
  { value: 7 },
  { value: 4 },
  { value: 1 },
  { value: -1 },
  { value: -4 },
  { value: -6 },
  { value: -8 },
  { value: -10 },
  { value: -11 },
  { value: -12 },
  { value: -10 },
  { value: -8 },
  { value: -6 },
  { value: -4 },
  { value: -2 },
  { value: 1 },
  { value: 3 },
  { value: 5 },
  { value: 6 },
  { value: 3 },
  { value: 0 },
  { value: -2 },
  { value: -5 },
  { value: -7 },
  { value: -9 },
  { value: -11 },
  { value: -13 },
  { value: -15 },
  { value: -13 },
  { value: -11 },
  { value: -8 },
  { value: -5 },
  { value: -2 },
  { value: 0 },
  { value: -3 },
  { value: -6 },
  { value: -9 },
  { value: -12 },
  { value: -15 },
];

// Use custom or Tailwind standard colors: https://tailwindcss.com/docs/colors
const businessCards = [
  {
    title: "Revenue Variance",
    metric: "Monthly change from baseline",
    baseValue: "+15K",
    baseCurrency: "Start",
    targetValue: "-15K",
    targetCurrency: "End",
    data: revenueData,
    change: "Volatile",
    isPositive: false,
    color: "var(--color-blue-500)",
  },
  {
    title: "Conversion Change",
    metric: "Rate variance from zero",
    baseValue: "50%",
    baseCurrency: "Baseline",
    targetValue: "+60.5%",
    targetCurrency: "Current",
    data: conversionData,
    change: "Cyclical",
    isPositive: true,
    color: "var(--color-emerald-500)",
  },
  {
    title: "Performance Drift",
    metric: "System variance tracking",
    baseValue: "+5%",
    baseCurrency: "Peak",
    targetValue: "-15%",
    targetCurrency: "Low",
    data: performanceData,
    change: "Declining",
    isPositive: false,
    color: "var(--color-amber-500)",
  },
];

export default function LineChart8() {
  return (
    <div className="min-h-screen flex items-center justify-center p-6 lg:p-12">
      {/* Container */}
      <div className="@container grow w-full max-w-7xl">
        {/* Grid */}
        <div className="grid grid-cols-1 @3xl:grid-cols-3 gap-6">
          {/* Business Cards */}
          {businessCards.map((card, i) => (
            <Card key={i}>
              <CardContent className="flex flex-col gap-6">
                {/* Header */}
                <div className="flex flex-col">
                  <h3 className="text-base font-semibold text-foreground m-0">
                    {card.title}
                  </h3>
                  <p className="text-sm text-muted-foreground m-0">
                    {card.metric}
                  </p>
                </div>

                {/* Chart Section */}
                <div className="flex items-center justify-between">
                  {/* Left side - Base Currency */}
                  <div className="text-center">
                    <div className="text-lg font-semibold text-foreground">
                      {card.baseValue}
                    </div>
                    <div className="text-xs text-muted-foreground font-medium">
                      {card.baseCurrency}
                    </div>
                  </div>

                  {/* Center - Mini Chart */}
                  <div className="flex-1 h-14 mx-6 relative">
                    <ResponsiveContainer width="100%" height="100%">
                      <LineChart
                        data={card.data}
                        margin={{
                          top: 10,
                          right: 10,
                          left: 10,
                          bottom: 10,
                        }}
                      >
                        <YAxis domain={["dataMin", "dataMax"]} hide={true} />
                        <ReferenceLine
                          y={0}
                          stroke="var(--input)"
                          strokeWidth={1}
                          strokeDasharray="3 3"
                        />
                        <Tooltip
                          cursor={{
                            stroke: card.color,
                            strokeWidth: 1,
                            strokeDasharray: "2 2",
                          }}
                          position={{ x: undefined, y: undefined }}
                          offset={10}
                          allowEscapeViewBox={{ x: true, y: true }}
                          content={({ active, payload, coordinate }) => {
                            if (
                              active &&
                              payload &&
                              payload.length &&
                              coordinate
                            ) {
                              const value = payload[0].value;
                              const formatValue = (val: number) => {
                                if (card.title === "Revenue Variance") {
                                  return val >= 0
                                    ? `+$${val.toLocaleString()}`
                                    : `-$${Math.abs(val).toLocaleString()}`;
                                } else if (card.title === "Conversion Change") {
                                  return val >= 0
                                    ? `+${val.toFixed(1)}%`
                                    : `${val.toFixed(1)}%`;
                                } else {
                                  return val >= 0 ? `+${val}%` : `${val}%`;
                                }
                              };

                              // Smart positioning logic
                              const tooltipStyle: React.CSSProperties = {
                                transform:
                                  coordinate.x && coordinate.x > 120
                                    ? "translateX(-100%)"
                                    : "translateX(10px)",
                                marginTop:
                                  coordinate.y && coordinate.y > 30
                                    ? "-40px"
                                    : "10px",
                              };

                              return (
                                <div
                                  className="bg-background/95 backdrop-blur-sm border border-border shadow-xl rounded-lg p-2.5 pointer-events-none z-50"
                                  style={tooltipStyle}
                                >
                                  <p className="text-sm font-semibold text-foreground leading-tight mb-1.5">
                                    {formatValue(value as number)}
                                  </p>
                                  <p className="text-xs text-muted-foreground leading-tight">
                                    {card.title}
                                  </p>
                                </div>
                              );
                            }
                            return null;
                          }}
                        />
                        <Line
                          type="monotone"
                          dataKey="value"
                          stroke={card.color}
                          strokeWidth={2}
                          dot={{
                            r: 0,
                            strokeWidth: 0,
                          }}
                          activeDot={{
                            r: 5,
                            fill: card.color,
                            stroke: "white",
                            strokeWidth: 2,
                            filter: `drop-shadow(0 0 6px ${card.color})`,
                          }}
                        />
                      </LineChart>
                    </ResponsiveContainer>
                  </div>

                  {/* Right side - Target Currency */}
                  <div className="text-center">
                    <div className="text-lg font-semibold text-foreground">
                      {card.targetValue}
                    </div>
                    <div className="text-xs text-muted-foreground font-medium">
                      {card.targetCurrency}
                    </div>
                  </div>
                </div>
              </CardContent>
            </Card>
          ))}
        </div>
      </div>
    </div>
  );
}
Component Data
- Name:
- Line Chart 8 – Compact Sparkline Metric Cards
- Access:
- Pro
- Created:
- 2025-12-01
- Updated:
- 2026-02-01
- Released:
- N/A
- Type:
- Block
line-chartsparklinechartdashboardanalyticsmetricscompactrechartstailwindreact
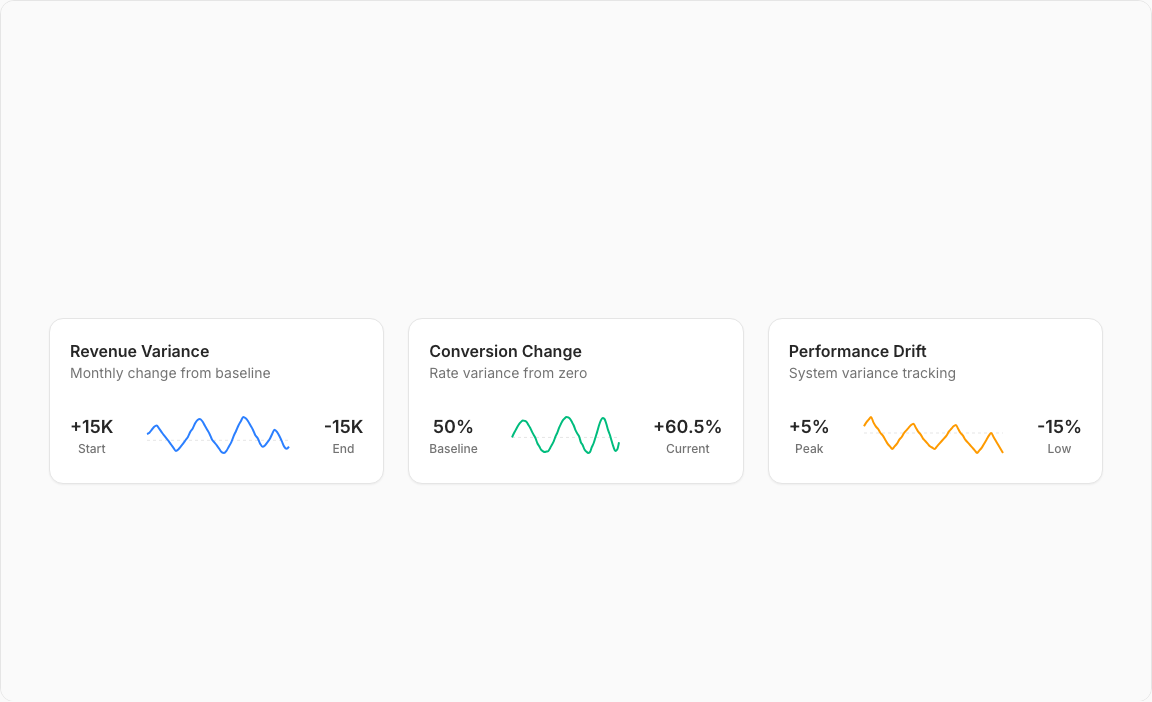
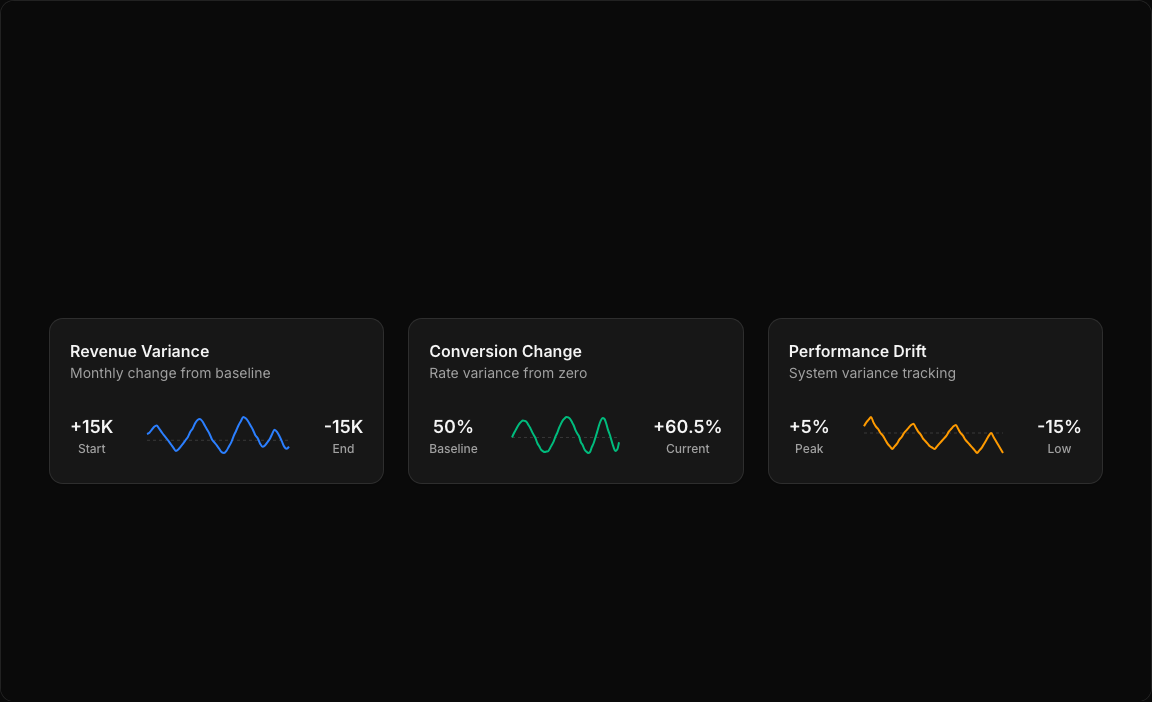
Line Chart 8 – Sparkline Metric Cards
A collection of three compact metric cards with embedded mini line charts (sparklines). Each card displays a different business metric with wave-pattern data visualization.
Key Features
- Three Metric Types – SaaS Revenue, Conversion Rate, API Response Time.
- Embedded Sparklines – Compact line charts within cards.
- Wave Patterns – Oscillating data showing fluctuations.
- Trend Display – Current value prominently displayed.
- Minimal Design – Clean, distraction-free presentation.
Visual Design
- Sparkline Colors – Unique color per metric type.
- Responsive Container – Adapts to available width.
- Compact Layout – Maximum information in minimal space.
Use Cases
- Dashboard Widgets – Quick-glance KPI monitoring.
- Admin Panels – System health indicators.
- Status Pages – Service performance metrics.
- Portfolio Views – Multiple metric overview.
Technical Stack
- Recharts – LineChart with ResponsiveContainer.
- Tailwind CSS – Utility styling for compact layout.
- Radix UI – Card component base.
Didn't find what you were looking for?
Suggest block