"use client";
import React, { useState } from "react";
import { Button } from "@/registry/default/ui/button/radix";
import {
Card,
CardContent,
CardHeader,
CardTitle,
CardToolbar,
} from "@/registry/default/ui/card/radix";
import {
ChartConfig,
ChartContainer,
ChartTooltip,
} from "@/registry/default/ui/chart";
import {
ToggleGroup,
ToggleGroupItem,
} from "@/registry/default/ui/toggle-group";
import { ArrowDownRight, ArrowUpRight, Settings } from "lucide-react";
import { Line, LineChart, XAxis, YAxis } from "recharts";
import { cn } from "@/lib/utils";
// NFT Collection analytics data for different time periods
const nftData = {
week: [
{ period: "Mon", value: 2.1 },
{ period: "Tue", value: 4.2 },
{ period: "Wed", value: 2.8 },
{ period: "Thu", value: 5.1 },
{ period: "Fri", value: 3.3 },
{ period: "Sat", value: 6.2 },
{ period: "Sun", value: 4.9 },
],
month: [
{ period: "Jan", value: 1.2 },
{ period: "Feb", value: 2.8 },
{ period: "Mar", value: 1.9 },
{ period: "Apr", value: 3.4 },
{ period: "May", value: 2.7 },
{ period: "Jun", value: 4.1 },
{ period: "Jul", value: 3.2 },
{ period: "Aug", value: 5.4 },
{ period: "Sep", value: 4.8 },
{ period: "Oct", value: 6.1 },
{ period: "Nov", value: 5.2 },
{ period: "Dec", value: 6.8 },
],
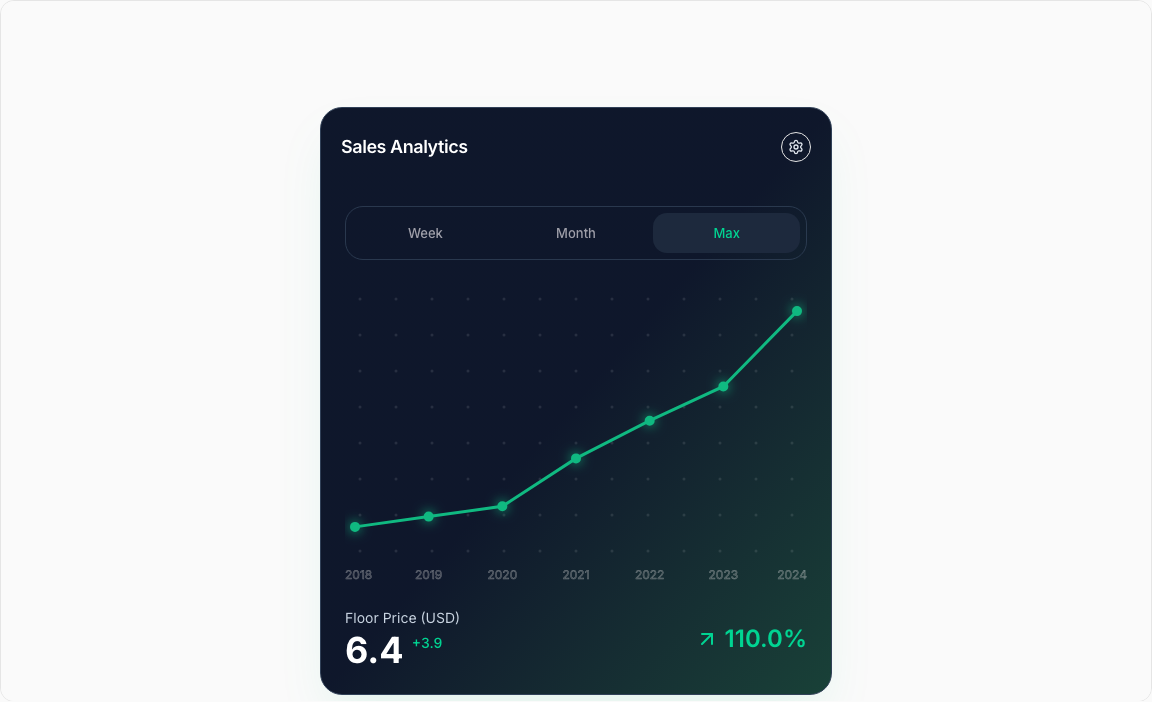
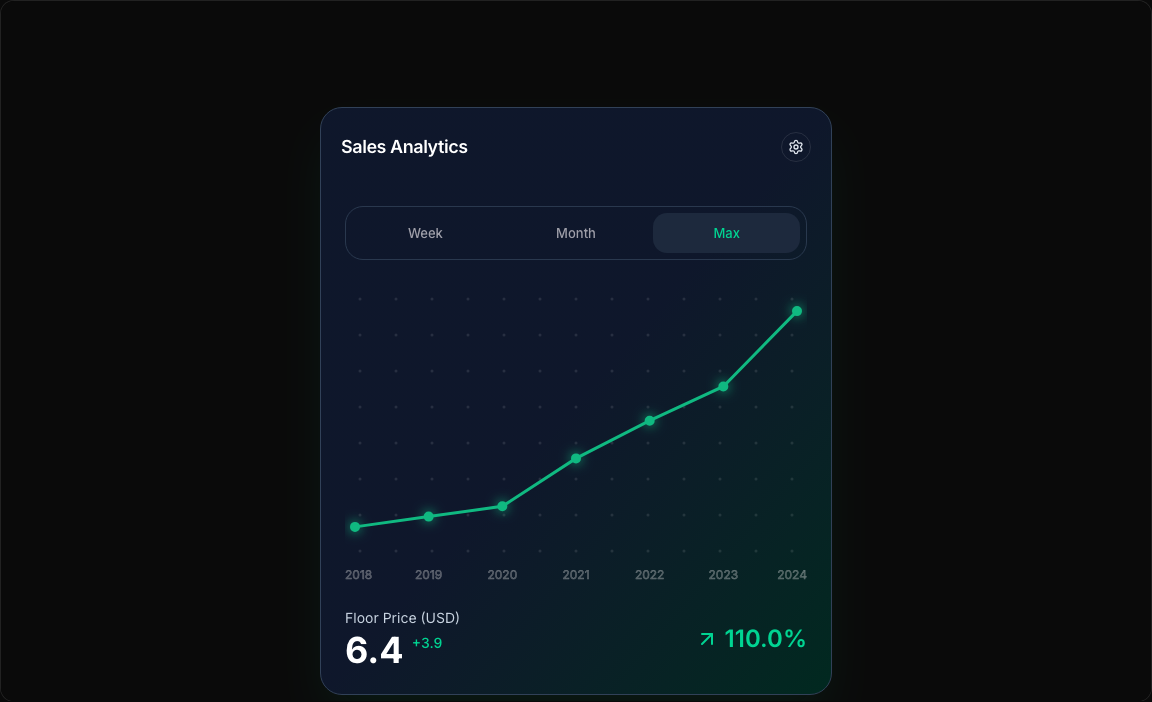
max: [
{ period: "2018", value: 0.1 },
{ period: "2019", value: 0.4 },
{ period: "2020", value: 0.7 },
{ period: "2021", value: 2.1 },
{ period: "2022", value: 3.2 },
{ period: "2023", value: 4.2 },
{ period: "2024", value: 6.4 },
],
};
type PeriodKey = keyof typeof nftData;
const PERIODS = {
week: { key: "week", label: "Week" },
month: { key: "month", label: "Month" },
max: { key: "max", label: "Max" },
} as const;
// Chart configuration with emerald theme
const chartConfig = {
value: {
label: "NFT Floor Price",
color: "var(--color-emerald-500)",
},
} satisfies ChartConfig;
// Custom Tooltip
interface TooltipProps {
active?: boolean;
payload?: Array<{
dataKey: string;
value: number;
color: string;
}>;
label?: string;
}
const CustomTooltip = ({ active, payload, label }: TooltipProps) => {
if (active && payload && payload.length) {
return (
<div className="rounded-lg border border-slate-700 bg-slate-800 p-3 shadow-md shadow-slate-100/5 min-w-[120px]">
<div className="text-xs font-medium text-white/60 tracking-wide mb-2">
{label}
</div>
<div className="text-sm font-semibold text-white">
{payload[0].value} USD
</div>
</div>
);
}
return null;
};
export default function LineChart7() {
const [selectedPeriod, setSelectedPeriod] = useState<PeriodKey>("max");
const currentData = nftData[selectedPeriod];
const currentValue = currentData[currentData.length - 1]?.value || 0;
const previousValue = currentData[currentData.length - 2]?.value || 0;
const growth =
previousValue > 0
? ((currentValue - previousValue) / previousValue) * 100
: 0;
return (
<div className="min-h-screen flex items-center justify-center p-6 lg:p-8">
<Card className="w-full rounded-3xl lg:max-w-lg bg-gradient-to-br from-slate-900 via-slate-900 to-emerald-950/90 border-slate-700 text-white shadow-2xl shadow-emerald-500/10">
<CardHeader className="border-0 min-h-auto pt-6 pb-6">
<CardTitle className="text-lg font-semibold">
Sales Analytics
</CardTitle>
<CardToolbar>
<Button variant="outline" size="icon-sm">
<Settings className="size-4 text-slate-200" />
</Button>
</CardToolbar>
</CardHeader>
<CardContent className="px-6 pb-6 space-y-6">
{/* Toggle Period Selector */}
<ToggleGroup
type="single"
value={selectedPeriod}
onValueChange={(value) =>
value && setSelectedPeriod(value as PeriodKey)
}
className="w-full rounded-2xl border border-slate-700/80 p-1.5"
>
{Object.values(PERIODS).map((period) => (
<ToggleGroupItem
key={period.key}
value={period.key}
className="h-10 shadow-none! rounded-xl flex-1 border-0 data-[state=on]:bg-slate-800 data-[state=on]:text-emerald-400 text-zinc-400 hover:bg-transparent hover:text-emerald-300"
>
{period.label}
</ToggleGroupItem>
))}
</ToggleGroup>
{/* Chart Container */}
<div className="relative">
<ChartContainer
config={chartConfig}
className="h-[300px] w-full [&_.recharts-curve.recharts-tooltip-cursor]:stroke-initial"
>
<LineChart
data={currentData}
margin={{
top: 10,
right: 10,
left: 10,
bottom: 10,
}}
>
<XAxis
dataKey="period"
axisLine={false}
tickLine={false}
tick={{
fontSize: 12,
strokeWidth: 0.5,
stroke: "rgb(255, 255, 255)",
opacity: 0.4,
}}
tickMargin={20}
interval="preserveStartEnd"
/>
<YAxis hide domain={["dataMin - 0.5", "dataMax + 0.5"]} />
<ChartTooltip
content={<CustomTooltip />}
cursor={{
strokeDasharray: "2 2",
stroke: "rgb(16 185 129)",
strokeOpacity: 0.6,
}}
/>
{/* Background pattern for chart area only */}
<defs>
<pattern
id="dotGridDark"
x="0"
y="0"
width="36"
height="36"
patternUnits="userSpaceOnUse"
>
<circle
cx="15"
cy="15"
r="1.5"
fill="#ffffff"
fillOpacity="0.1"
/>
</pattern>
</defs>
<rect
x="10px"
y="-30px"
width="100%"
height="100%"
fill="url(#dotGridDark)"
style={{ pointerEvents: "none" }}
/>
{/* Main line with sharp angles */}
<Line
type="linear"
dataKey="value"
stroke="rgb(16 185 129)"
strokeWidth={3}
dot={{
r: 4,
fill: "rgb(16 185 129)",
stroke: "rgb(16 185 129)",
strokeWidth: 2,
filter: "drop-shadow(0 0 6px rgb(16 185 129))",
}}
activeDot={{
r: 6,
stroke: "rgb(16 185 129)",
strokeWidth: 3,
fill: "rgb(16 185 129)",
filter: "drop-shadow(0 0 8px rgb(16 185 129))",
}}
/>
{/* Endpoint dot */}
<Line
type="linear"
dataKey="value"
stroke="transparent"
strokeWidth={0}
dot={false}
activeDot={{
r: 7,
stroke: "rgb(16 185 129)",
strokeWidth: 4,
fill: "rgb(16 185 129)",
filter: "drop-shadow(0 0 10px rgb(16 185 129))",
}}
/>
</LineChart>
</ChartContainer>
</div>
{/* Statistics */}
<div className="flex items-center gap-2.5 justify-between">
{/* Floor Price */}
<div className="flex flex-col gap-0.5">
<div className="text-sm text-slate-300">Floor Price (USD)</div>
<div className="flex items-start gap-2">
<span className="text-4xl font-bold text-white">
{currentValue.toFixed(1)}
</span>
<span className="text-sm text-emerald-400 font-medium pt-0.75">
+{(currentValue - 2.5).toFixed(1)}
</span>
</div>
</div>
{/* Growth */}
<div
className={cn(
"flex items-center gap-1.5",
growth > 0 ? "text-emerald-400" : "text-destructive",
)}
>
{growth > 0 ? (
<ArrowUpRight className="size-6" />
) : (
<ArrowDownRight className="size-6" />
)}
<span className="text-2xl font-semibold">
{(growth * 2.1).toFixed(1)}%
</span>
</div>
</div>
</CardContent>
</Card>
</div>
);
}