line-chart-3
Single block view - Copy and use this block in your project: line-chart-3
Loading...
charts/line-charts/line-chart-3.tsx
"use client";

import React, { useState } from "react";
import { Button } from "@/registry/default/ui/button/radix";
import {
  Card,
  CardContent,
  CardHeader,
  CardTitle,
  CardToolbar,
} from "@/registry/default/ui/card/radix";
import {
  ChartConfig,
  ChartContainer,
  ChartTooltip,
  ChartTooltipContent,
} from "@/registry/default/ui/chart";
import {
  ToggleGroup,
  ToggleGroupItem,
} from "@/registry/default/ui/toggle-group";
import { ChartNoAxesCombined, Info } from "lucide-react";
import { CartesianGrid, Line, LineChart } from "recharts";

// Revenue performance data for different periods (in thousands)
const revenueData = {
  "5D": [
    { period: "Mon", revenue: 10.2, fill: "var(--color-revenue)" },
    { period: "Tue", revenue: 62.8, fill: "var(--color-revenue)" },
    { period: "Wed", revenue: 38.1, fill: "var(--color-revenue)" },
    { period: "Thu", revenue: 71.4, fill: "var(--color-revenue)" },
    { period: "Fri", revenue: 54.7, fill: "var(--color-revenue)" },
    { period: "Sat", revenue: 29.3, fill: "var(--color-revenue)" },
    { period: "Sun", revenue: 40.6, fill: "var(--color-revenue)" },
  ],
  "2W": [
    { period: "W1", revenue: 324.5, fill: "var(--color-revenue)" },
    { period: "W2", revenue: 398.7, fill: "var(--color-revenue)" },
    { period: "W3", revenue: 276.3, fill: "var(--color-revenue)" },
    { period: "W4", revenue: 445.9, fill: "var(--color-revenue)" },
    { period: "W5", revenue: 387.2, fill: "var(--color-revenue)" },
    { period: "W6", revenue: 512.8, fill: "var(--color-revenue)" },
    { period: "W7", revenue: 358.4, fill: "var(--color-revenue)" },
    { period: "W8", revenue: 478.6, fill: "var(--color-revenue)" },
  ],
  "1M": [
    { period: "W1", revenue: 324.5, fill: "var(--color-revenue)" },
    { period: "W2", revenue: 398.7, fill: "var(--color-revenue)" },
    { period: "W3", revenue: 276.3, fill: "var(--color-revenue)" },
    { period: "W4", revenue: 445.9, fill: "var(--color-revenue)" },
    { period: "W5", revenue: 387.2, fill: "var(--color-revenue)" },
    { period: "W6", revenue: 512.8, fill: "var(--color-revenue)" },
    { period: "W7", revenue: 358.4, fill: "var(--color-revenue)" },
    { period: "W8", revenue: 478.6, fill: "var(--color-revenue)" },
    { period: "W9", revenue: 423.1, fill: "var(--color-revenue)" },
    { period: "W10", revenue: 567.3, fill: "var(--color-revenue)" },
    { period: "W11", revenue: 489.7, fill: "var(--color-revenue)" },
    { period: "W12", revenue: 534.2, fill: "var(--color-revenue)" },
  ],
  "6M": [
    { period: "Jan", revenue: 1875.3, fill: "var(--color-revenue)" },
    { period: "Feb", revenue: 2234.7, fill: "var(--color-revenue)" },
    { period: "Mar", revenue: 1698.2, fill: "var(--color-revenue)" },
    { period: "Apr", revenue: 2567.8, fill: "var(--color-revenue)" },
    { period: "May", revenue: 2145.6, fill: "var(--color-revenue)" },
    { period: "Jun", revenue: 2789.4, fill: "var(--color-revenue)" },
    { period: "Jul", revenue: 2356.1, fill: "var(--color-revenue)" },
    { period: "Aug", revenue: 3012.5, fill: "var(--color-revenue)" },
    { period: "Sep", revenue: 2687.9, fill: "var(--color-revenue)" },
    { period: "Oct", revenue: 3234.8, fill: "var(--color-revenue)" },
    { period: "Nov", revenue: 2891.3, fill: "var(--color-revenue)" },
    { period: "Dec", revenue: 3456.7, fill: "var(--color-revenue)" },
  ],
  "1Y": [
    { period: "Q1 2023", revenue: 5808.2, fill: "var(--color-revenue)" },
    { period: "Q2 2023", revenue: 7501.8, fill: "var(--color-revenue)" },
    { period: "Q3 2023", revenue: 6234.7, fill: "var(--color-revenue)" },
    { period: "Q4 2023", revenue: 8456.3, fill: "var(--color-revenue)" },
    { period: "Q1 2024", revenue: 7123.9, fill: "var(--color-revenue)" },
    { period: "Q2 2024", revenue: 9287.5, fill: "var(--color-revenue)" },
    { period: "Q3 2024", revenue: 8567.1, fill: "var(--color-revenue)" },
    { period: "Q4 2024", revenue: 10234.6, fill: "var(--color-revenue)" },
  ],
};

// Use custom or Tailwind standard colors: https://tailwindcss.com/docs/colors
const chartConfig = {
  revenue: {
    label: "Revenue",
    color: "var(--color-violet-500)",
  },
} satisfies ChartConfig;

// Period configuration
const PERIODS = {
  "5D": { key: "5D", label: "5D" },
  "2W": { key: "2W", label: "2W" },
  "1M": { key: "1M", label: "1M" },
  "6M": { key: "6M", label: "6M" },
  "1Y": { key: "1Y", label: "1Y" },
} as const;

type PeriodKey = keyof typeof PERIODS;

export default function LineChart3() {
  const [selectedPeriod, setSelectedPeriod] = useState<PeriodKey>("5D");

  // Get data for selected period
  const currentData = revenueData[selectedPeriod];

  // Calculate total revenue dynamically based on selected period
  const totalRevenue = currentData.reduce((sum, item) => sum + item.revenue, 0);

  // Format total revenue display
  const formatRevenue = (amount: number) => {
    if (amount >= 1000) {
      return `${(amount / 1000).toFixed(1)}M`;
    }
    return `${amount.toFixed(0)}k`;
  };

  return (
    <div className="min-h-screen flex items-center justify-center p-6 lg:p-8">
      <Card className="w-full max-w-md rounded-2xl shadow-sm p-6">
        <CardHeader className="p-0 pb-6 mb-6">
          <CardTitle className="text-lg font-semibold">
            Revenue Performance
          </CardTitle>
          <CardToolbar>
            <Button variant="outline">Export</Button>
          </CardToolbar>
        </CardHeader>

        <CardContent className="p-0 space-y-6">
          {/* Nav */}
          <div className="space-y-6 mb-6">
            {/* Stats Section */}
            <div className="flex items-center gap-4">
              <div className="size-12 bg-violet-100 border border-violet-200 dark:border-violet-800 dark:bg-violet-950 rounded-full flex items-center justify-center">
                <ChartNoAxesCombined className="w-6 h-6 text-violet-600" />
              </div>
              <div>
                <div className="text-xs font-medium text-muted-foreground uppercase tracking-wide mb-1">
                  Total Revenue
                </div>
                <div className="text-2xl font-bold">
                  ${formatRevenue(totalRevenue)}
                </div>
              </div>
            </div>

            {/* Toggle Group */}
            <ToggleGroup
              type="single"
              value={selectedPeriod}
              variant="outline"
              onValueChange={(value) =>
                value && setSelectedPeriod(value as PeriodKey)
              }
              className="w-full"
            >
              {Object.values(PERIODS).map((period) => (
                <ToggleGroupItem
                  key={period.key}
                  value={period.key}
                  variant="outline"
                  className="flex-1 data-[state=on]:bg-gray-900 data-[state=on]:text-white data-[state=on]:border-gray-900"
                >
                  {period.label}
                </ToggleGroupItem>
              ))}
            </ToggleGroup>
          </div>

          {/* Chart */}
          <div className="h-40 relative w-full overflow-hidden">
            <ChartContainer
              config={chartConfig}
              className="h-full w-full [&_.recharts-curve.recharts-tooltip-cursor]:stroke-initial"
            >
              <LineChart
                accessibilityLayer
                data={currentData}
                margin={{
                  top: 10,
                  left: 10,
                  right: 10,
                  bottom: 10,
                }}
              >
                <CartesianGrid
                  strokeDasharray="4 8"
                  stroke="var(--input)"
                  strokeOpacity={1}
                  horizontal={false}
                  vertical={true}
                />

                <ChartTooltip
                  cursor={{
                    stroke: chartConfig.revenue.color,
                    strokeWidth: 1,
                    strokeDasharray: "2 4",
                  }}
                  content={
                    <ChartTooltipContent
                      indicator="line"
                      nameKey="revenue"
                      hideLabel
                    />
                  }
                />
                <Line
                  dataKey="revenue"
                  type="natural"
                  stroke="var(--color-revenue)"
                  strokeWidth={2}
                  dot={false}
                  activeDot={{
                    r: 4,
                    fill: "var(--color-revenue)",
                    stroke: "var(--color-revenue)",
                    strokeWidth: 0,
                  }}
                />
              </LineChart>
            </ChartContainer>
          </div>

          {/* Footer Note */}
          <div className="flex items-center gap-2 text-xs text-muted-foreground">
            <Info className="size-3.5" />
            <span>Revenue includes subscription and one-time payments.</span>
          </div>
        </CardContent>
      </Card>
    </div>
  );
}
Component Data
- Name:
- Line Chart 3 – Revenue Performance with Toggle Periods
- Access:
- Pro
- Created:
- 2025-12-01
- Updated:
- 2026-02-01
- Released:
- N/A
- Type:
- Block
line-chartchartdashboardanalyticsrevenuetogglerechartstailwindreact
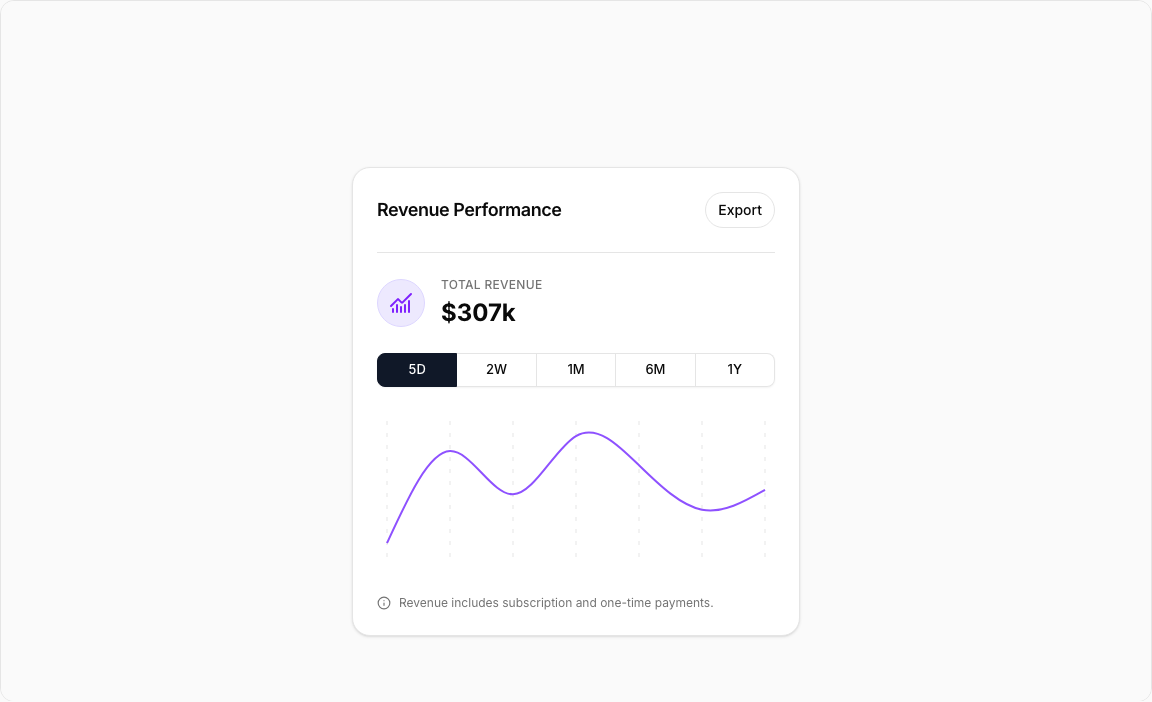
Line Chart 3 – Revenue Performance Chart
A stylish revenue visualization with an integrated toggle group for period selection. Features a clean design with chart icon, total revenue calculation, and smooth line animations.
Key Features
- Toggle Period Selector – 5D, 2W, 1M, 6M, 1Y options with instant data switch.
- Dynamic Total Calculation – Revenue sum updates based on selected period.
- Chart Icon Badge – Violet-themed icon container in header.
- Export Button – Quick access to data export functionality.
- Smooth Curves – Natural line interpolation for data flow.
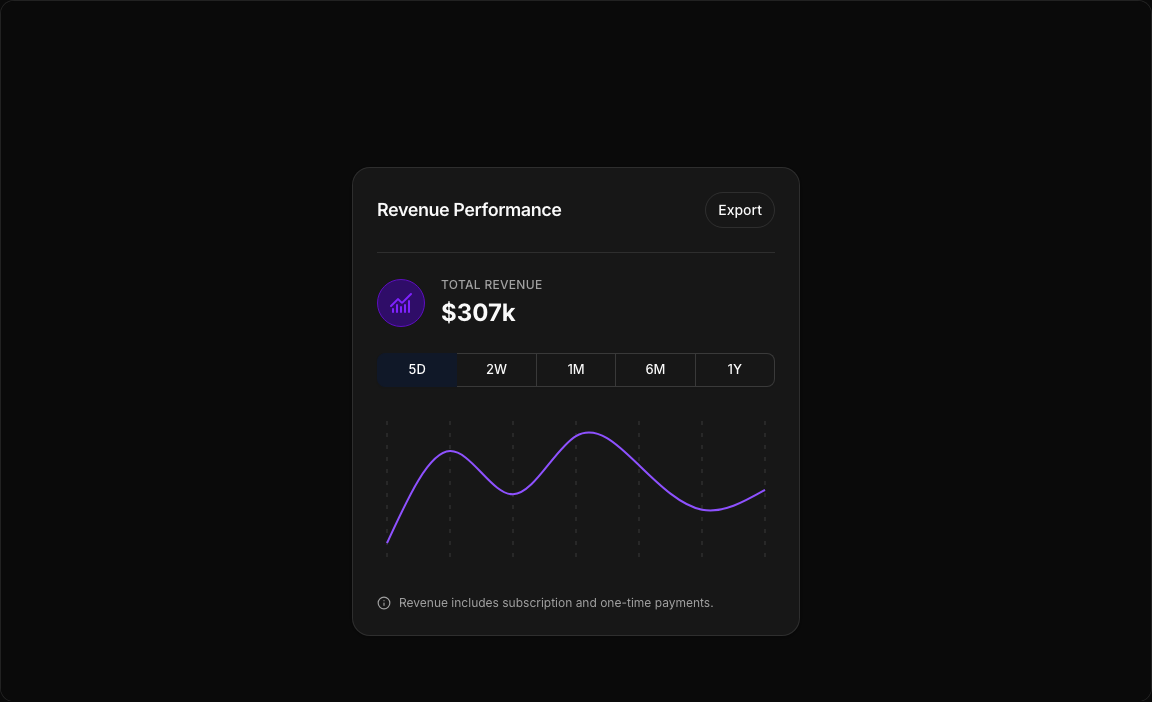
Visual Design
- Color Scheme – Violet-500 line with violet-100/950 icon backgrounds.
- Toggle Styling – Gray-900 background when selected, white text.
- Compact Layout – Efficient use of space in card format.
Use Cases
- SaaS Revenue Tracking – Monitor MRR/ARR across time periods.
- E-commerce Analytics – Track sales performance trends.
- Subscription Metrics – Visualize recurring revenue growth.
- Financial Reporting – Period-based revenue comparisons.
Technical Stack
- Recharts – LineChart with CartesianGrid and smooth curves.
- Tailwind CSS – Violet accent colors.
- Radix UI – ToggleGroup, Card, Button components.
- Lucide Icons – ChartNoAxesCombined, Info icons.
Didn't find what you were looking for?
Suggest block